


What Is Descriptive Analytics? A Complete 2025 Guide
1. Platform Category: Data Analytics Method
2. Core Technology/Architecture: Data Aggregation, Statistical Reporting, Data Visualization
3. Key Data Governance Feature: Data Quality Assurance, Metadata Documentation
4. Primary AI/ML Integration: Provides foundational insights for predictive and prescriptive AI models
5. Main Competitors/Alternatives: Diagnostic Analytics, Predictive Analytics, Prescriptive Analytics
In the rapidly evolving landscape of data science, understanding the nuances of various analytical approaches is paramount. Descriptive Analytics forms the foundational bedrock of this understanding, serving as the critical first step in transforming raw data into actionable intelligence. It provides an indispensable lens through which organizations can scrutinize past events, answering the fundamental question: “What happened?” This guide delves into the essence of Descriptive Analytics, its architectural components, its profound business value, and its enduring relevance in the dynamic year 2025.
Introduction to Descriptive Analytics in a Data-Driven World
The sheer volume and velocity of data generated across industries today necessitate robust analytical frameworks to derive meaningful insights. Among these, Descriptive Analytics stands out as the most accessible and widely applied method, focusing on the aggregation and summarization of historical data to identify patterns and trends. While advanced analytics often capture headlines, the ability to clearly understand past performance remains the cornerstone for any successful data strategy. Its objective is not to predict or prescribe, but rather to distill complex datasets into simple, understandable narratives, empowering stakeholders across all levels to grasp their operational history and current state with clarity and precision. By mastering Descriptive Analytics, businesses lay a solid groundwork for more complex analytical endeavors, ensuring that every subsequent data-driven decision is anchored in accurate historical context.
Core Breakdown: Unpacking the Mechanisms of Descriptive Analytics
At its heart, Descriptive Analytics is about making sense of the past. It employs a suite of techniques and tools to collect, process, and present historical data in a digestible format. This section explores its defining characteristics, practical applications, and the vital role it plays in business operations.
Defining Descriptive Analytics
This essential field primarily aggregates and summarizes historical data. It transforms raw numbers into digestible information, making complex datasets comprehensible to a broad audience. Through techniques like calculating mean, median, mode, and frequency distributions, Descriptive Analytics provides a clear snapshot of past performance and identifies prevalent trends. Its core function is simply to describe the data as it exists, offering a clear, unambiguous view of “what happened” without delving into “why” or “what next.” This backward-looking perspective is crucial for establishing benchmarks, identifying anomalies, and understanding the general behavior of various data points over time.
Key Characteristics and Benefits
Descriptive Analytics is characterized by its backward-looking nature, analyzing events that have already occurred without attempting to predict the future. Its main benefit lies in its ability to offer immediate, actionable insights into historical patterns and operational outcomes. This clarity helps businesses quickly grasp their current situation, understand past successes or failures, and pinpoint areas for further investigation or improvement. Key benefits include simplicity, ease of understanding for non-technical users, and its fundamental role in creating a common operational picture across departments. It allows for the identification of seasonal trends, recurring issues, and consistent successes, which are vital for strategic planning and resource allocation.
Common Tools and Techniques
Practical applications of Descriptive Analytics often involve readily available business intelligence (BI) dashboards, comprehensive reporting tools, and even advanced spreadsheet functionalities. Visualization techniques are paramount, utilizing clear bar charts, informative pie graphs, and illustrative line charts to effectively display trends, highlight anomalies, and show data distributions. Statistical measures such as averages, sums, counts, and percentages are frequently employed to summarize data. Tools like Tableau, Power BI, Qlik Sense, and even sophisticated Excel spreadsheets are often used to implement descriptive analytical techniques, making data accessible and interpretable for decision-makers across all organizational levels.
Real-World Applications in 2025
In 2025, Descriptive Analytics continues to be indispensable for tracking key performance indicators (KPIs) such as sales figures, monitoring website traffic patterns, and analyzing comprehensive customer demographics. Companies widely use it to assess the effectiveness of marketing campaigns by reporting on engagement rates and conversions, identify bottlenecks within supply chains by analyzing delivery times and inventory levels, and thoroughly evaluate financial performance through profit and loss statements and balance sheets. It provides a crucial factual basis for informed strategic planning and operational adjustments, ensuring that current business decisions are grounded in a clear understanding of past realities. From healthcare monitoring patient outcomes to governmental agencies tracking public service utilization, its applications are vast and varied, underpinning virtually every data-driven sector.
Challenges and Limitations in Descriptive Analytics Adoption
While fundamental, Descriptive Analytics is not without its challenges. One significant barrier is the risk of misinterpretation; simply knowing “what happened” without the context of “why” can lead to flawed conclusions. Decision-makers might identify a trend but incorrectly attribute its cause or miss underlying factors. Another limitation is the “so what?” problem – descriptive reports, while informative, often lack the depth to suggest specific actions or future outcomes directly. They reveal patterns but don’t inherently explain their causality or predict their continuation. Furthermore, the quality of insights derived is entirely dependent on the quality of the historical data; “garbage in, garbage out” applies directly here, making robust data quality assurance and metadata documentation crucial. Scalability can also be an issue when dealing with petabytes of raw, unstructured data, requiring sophisticated data aggregation platforms to manage effectively. Without careful design and contextual understanding, descriptive reports can become overwhelming and fail to deliver truly actionable intelligence, potentially leading to analysis paralysis rather than decisive action.
Business Value and ROI of Effective Descriptive Analytics
The return on investment (ROI) from effective Descriptive Analytics is substantial and multifaceted. Firstly, it offers unparalleled operational transparency, allowing businesses to monitor performance in real-time or near real-time and quickly identify deviations from expected norms. This enables faster, more informed tactical decision-making, such as adjusting marketing spend based on immediate campaign performance or reallocating resources in response to sales trends. Secondly, it serves as the essential foundation for all advanced analytics. Without a clear descriptive understanding of the current state and historical trends, diagnostic, predictive, and prescriptive models lack context and reliability. Descriptive analytics helps in establishing performance benchmarks, enabling organizations to set realistic goals and measure progress accurately. Moreover, by providing clear, visual reports, it facilitates stakeholder alignment across departments, ensuring everyone operates from a common, data-backed understanding of the business’s situation. This shared clarity reduces debate over historical facts, allowing teams to focus on forward-looking strategies and problem-solving, thereby enhancing organizational efficiency and agility.
Comparative Insight: Descriptive Analytics in the Broader Analytics Landscape
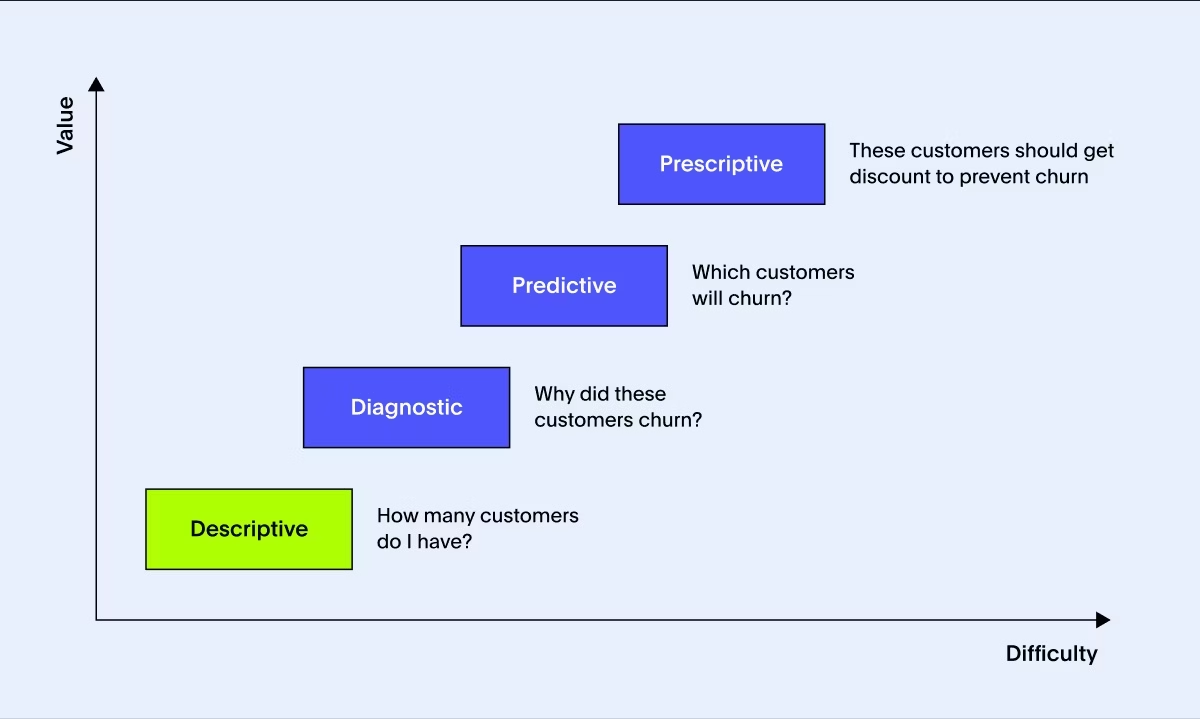
Understanding Descriptive Analytics is incomplete without appreciating its position relative to other analytical methodologies. While often seen as distinct, these approaches—descriptive, diagnostic, predictive, and prescriptive—form a progressive journey towards deeper insights and more proactive decision-making. Descriptive Analytics is the gateway, answering “what happened?” It provides the factual basis, aggregating and summarizing past events to present a clear picture of historical trends and patterns. This is where organizations identify key performance indicators (KPIs), track sales figures, and understand customer demographics.
Moving beyond description, Diagnostic Analytics addresses “why did it happen?” It digs deeper into the data using techniques like drill-down, data discovery, and correlation analysis to uncover the root causes of observed trends. For example, if descriptive analytics shows a sudden drop in sales, diagnostic analytics would investigate factors such as a change in marketing strategy, a competitor’s new product, or supply chain issues to pinpoint the reason. Without the initial descriptive report, the diagnostic process wouldn’t know where to start looking.
Next in the progression is Predictive Analytics, which forecasts “what will happen?” Using statistical models, machine learning algorithms, and historical data patterns identified by descriptive analysis, predictive analytics aims to predict future outcomes. This could involve forecasting future sales, predicting customer churn, or identifying potential risks. The accuracy of predictive models is heavily reliant on the quality and comprehensiveness of the historical data provided by descriptive processes, making the latter an indispensable prerequisite.
Finally, Prescriptive Analytics takes insights to the highest level by answering “what should be done?” It recommends specific actions to achieve desired outcomes or mitigate potential risks, often integrating with optimization and simulation techniques. Building upon descriptive, diagnostic, and predictive insights, prescriptive analytics suggests the best course of action. For instance, if predictive analytics forecasts a decline in sales, prescriptive analytics might recommend a targeted marketing campaign or a pricing adjustment. Each of these advanced analytics types relies heavily on the foundational understanding provided by descriptive analytics; without knowing what has happened, it is significantly harder, if not impossible, to accurately explain why, predict what will happen, or prescribe what should be done. Thus, descriptive analytics is not merely an alternative but an integral and enabling component of the entire analytical spectrum, providing the essential context that empowers subsequent, more complex analyses.

World2Data Verdict: The Enduring Power and Evolving Role of Descriptive Analytics
As the data landscape becomes increasingly complex with the advent of sophisticated AI and ML platforms, the fundamental role of Descriptive Analytics remains not only relevant but critically important. Our verdict at World2Data is clear: organizations must continue to prioritize robust descriptive capabilities as the indispensable first step in any data strategy. While predictive and prescriptive analytics offer tantalizing glimpses into the future and actionable recommendations, their efficacy is entirely contingent upon a deep, accurate understanding of past performance. Therefore, we recommend that businesses invest not only in advanced analytics tools but also in strengthening their foundational descriptive reporting, data visualization, and data quality frameworks. The future of data-driven decision-making will not diminish the need for understanding “what happened” but rather amplify it, as transparent and interpretable descriptive insights become the bedrock upon which all complex AI/ML models are built, ensuring explainability and trust. Embrace descriptive analytics not as a basic function, but as the enduring cornerstone that empowers all subsequent analytical innovation and drives truly informed business intelligence.
