ElasticSearch for Large-Scale Log Analytics: Unlocking Operational Intelligence
Platform Category: Log Management and Analytics Platform
Core Technology/Architecture: Distributed Search Engine, Open Source
Key Data Governance Feature: Role-Based Access Control
Primary AI/ML Integration: Built-in ML for Anomaly Detection and Forecasting
Main Competitors/Alternatives: Splunk, Datadog, AWS OpenSearch, Grafana Loki
ElasticSearch for large-scale log analytics is an indispensable tool for modern organizations grappling with an ever-increasing deluge of operational data. Understanding intricate system behaviors, user interactions, and potential security threats hinges on effectively collecting, processing, and analyzing these complex log streams in real-time. This article delves into how ElasticSearch empowers businesses to transform raw, unstructured log data into critical, actionable intelligence, driving operational excellence and robust security postures.
Introduction: The Imperative of Advanced Log Analytics
In today’s fast-paced digital landscape, every application, server, network device, and user interaction generates a continuous flow of log data. These logs contain a treasure trove of information, from critical error messages and performance metrics to security audit trails and user activity patterns. However, the sheer volume, velocity, and variety of this data present a significant challenge. Traditional monitoring tools and manual analysis methods are simply overwhelmed, leading to missed insights, prolonged troubleshooting times, and heightened security risks. The need for a robust, scalable solution for ElasticSearch Log Analytics has never been more pressing, as organizations strive to maintain peak performance, ensure system reliability, and safeguard their digital assets.
This deep dive will explore the architectural prowess of ElasticSearch, detailing its capabilities for high-performance indexing, real-time ingestion, and scalable analysis. We will examine how it addresses the inherent challenges of large-scale log management and the immense business value it delivers, especially when integrated with advanced features like machine learning for anomaly detection. Furthermore, we will compare its approach to traditional data storage paradigms and offer a forward-looking perspective on its role in the evolving ecosystem of observability and data platforms.
Core Breakdown: Architecture and Capabilities of ElasticSearch for Log Analytics
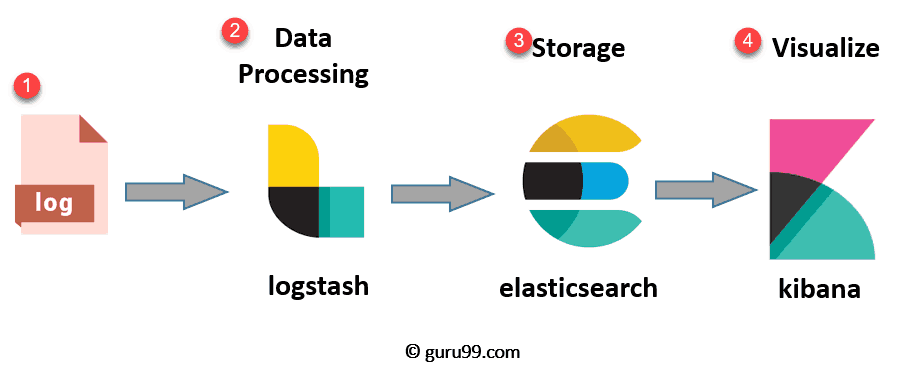
ElasticSearch, a distributed, open-source search and analytics engine, stands at the heart of the popular ELK Stack (Elasticsearch, Logstash, Kibana). Its architecture is specifically designed to handle the complexities of large-scale, unstructured log data with exceptional speed and flexibility. At its core, ElasticSearch operates by indexing incoming data, making it searchable in near real-time, and distributed across a cluster of nodes for horizontal scalability and fault tolerance.
High-Performance Indexing and Search
ElasticSearch excels at indexing vast quantities of unstructured and semi-structured log data with incredible speed. Unlike relational databases that require predefined schemas, ElasticSearch leverages a schema-on-write or dynamic mapping approach, allowing it to ingest varied log formats without extensive upfront configuration. Its inverted index architecture is fundamental to its lightning-fast full-text search capabilities. When a document (e.g., a log entry) is added, ElasticSearch breaks its text content into individual terms, storing them in an index that maps each term to the documents in which it appears. This structure allows for highly efficient and rapid retrieval of results, even across petabytes of information.
For example, if you search for an error code or a specific IP address, ElasticSearch can instantly pinpoint all relevant log entries across your entire dataset, spanning multiple days, weeks, or even months. This capability is crucial for quick incident response and security investigations, significantly reducing the time-to-insight.
Real-time Data Ingestion Capabilities
One of the most compelling features of ElasticSearch for ElasticSearch Log Analytics is its ability to ingest log events as they occur. When combined with data shippers like Logstash or Beats, ElasticSearch provides near real-time visibility into system health, application performance, and security events. Logstash, an open-source data collection pipeline, can dynamically parse, filter, and transform logs from numerous sources before forwarding them to ElasticSearch. Beats are lightweight data shippers that send various types of operational data (e.g., Filebeat for log files, Metricbeat for system metrics) directly to ElasticSearch or Logstash. This continuous data flow ensures that operational teams have an up-to-the-minute view of their environment, critical for immediate issue detection and proactive response.
The real-time nature allows organizations to identify anomalies, performance bottlenecks, or security breaches moments after they happen, rather than hours or days later. This immediate feedback loop is invaluable for DevOps, SRE, and security operations teams.
Scalability and Flexibility for Any Environment
ElasticSearch’s distributed architecture makes it inherently scalable. An ElasticSearch cluster can effortlessly scale out by simply adding more nodes. Data is divided into shards, which are distributed across the nodes, and each shard can have multiple replicas for fault tolerance and increased read performance. This horizontal scalability ensures that performance never degrades as data volumes grow, accommodating even the most demanding large-scale log analytics requirements. This means you can start small and expand your cluster as your log data increases, without significant re-architecture.
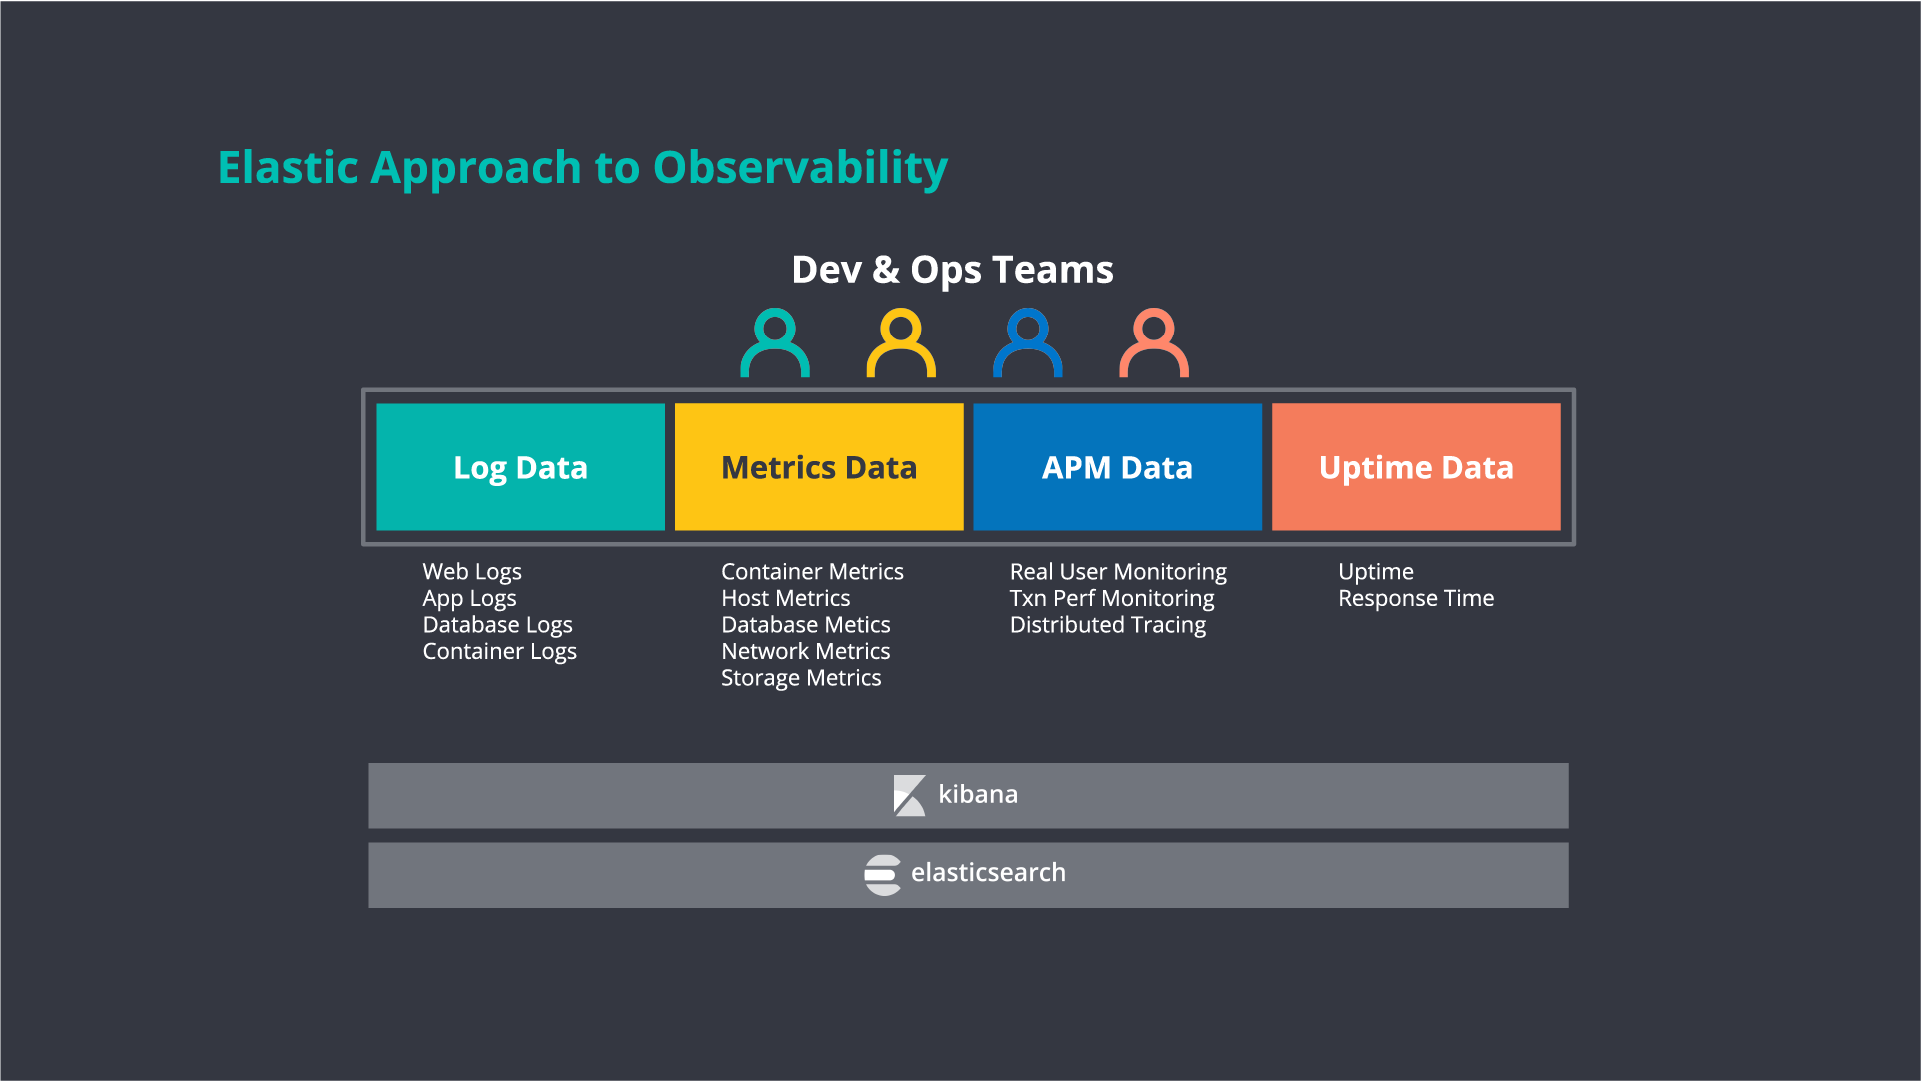
Furthermore, ElasticSearch adapts to diverse data sources and formats. Whether logs originate from cloud instances, on-premise servers, containerized applications, network devices, or custom applications, ElasticSearch offers a unified platform for collecting, parsing, and analyzing all your critical operational insights. This flexibility, coupled with its robust RESTful API, makes it a versatile component in any modern observability stack.
Advanced Features for Deeper Analysis
Beyond simple keyword searches, ElasticSearch’s powerful aggregation framework enables complex data analysis. Aggregations allow users to group data, calculate metrics (sum, average, min, max), and identify trends within vast log datasets. This capability is vital for uncovering patterns, correlating events across different systems, and performing root cause analysis. For instance, you can aggregate logs to find the average response time for a specific service over a period, or count error occurrences per application module.
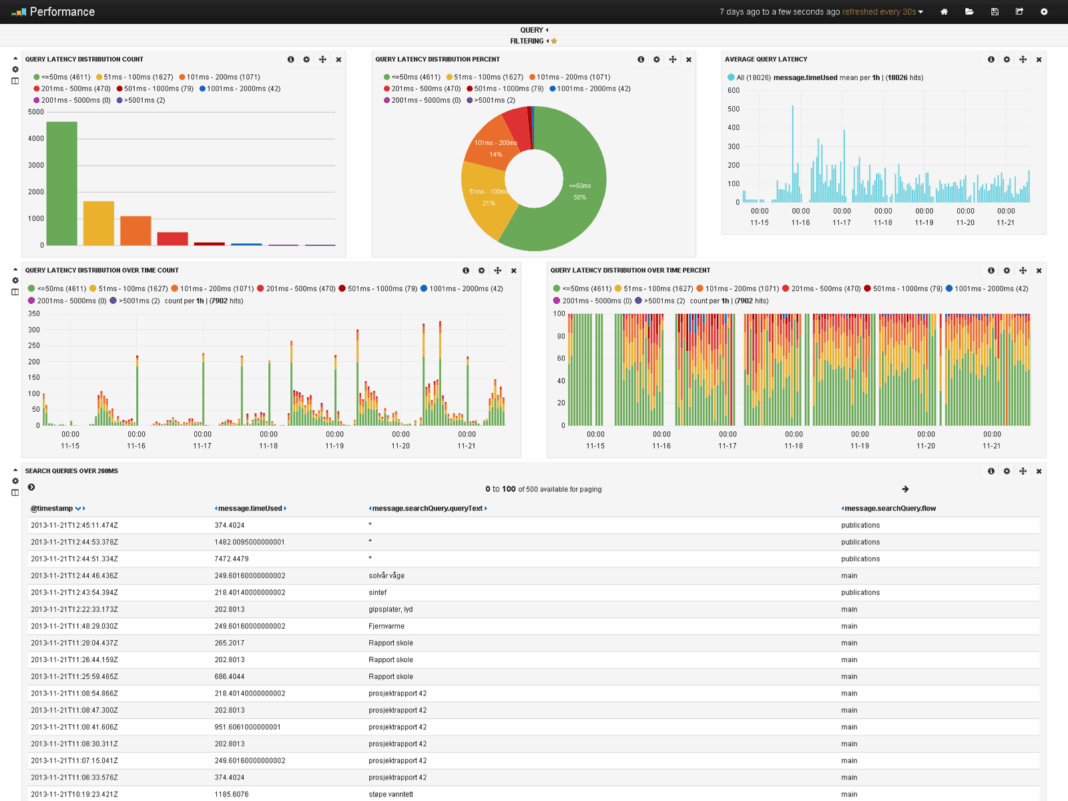
Integrated data visualization with Kibana, the ‘K’ in ELK, transforms raw logs into intuitive dashboards, charts, and graphs. Kibana provides a user-friendly interface for exploring, visualizing, and sharing insights from ElasticSearch data. This makes data exploration and interpretation accessible for everyone across the organization, from developers and operations engineers to business analysts and security professionals. Kibana also offers advanced features like machine learning for anomaly detection, alerting capabilities, and geospatial analysis, further enhancing the power of ElasticSearch for comprehensive log analytics.
Challenges and Barriers to Adoption
While ElasticSearch offers unparalleled capabilities for large-scale log analytics, its adoption is not without challenges. One significant barrier is the complexity of managing and optimizing large ElasticSearch clusters. Tuning performance, ensuring data retention policies are met, and managing hardware resources (CPU, RAM, disk I/O) can be resource-intensive and require specialized expertise. Data drift, where log formats or content change over time, can also break ingestion pipelines and require continuous maintenance of parsing rules.
Another challenge is cost management. Storing vast amounts of log data, especially for long retention periods, can lead to substantial infrastructure costs, particularly in cloud environments. Organizations must carefully balance their need for historical data with storage expenses. Furthermore, while ElasticSearch is open-source, the commercial Elastic Stack offers proprietary features (like advanced security, machine learning, and support) that may increase costs for enterprises requiring these functionalities. The initial learning curve for setting up, configuring, and effectively utilizing the entire ELK Stack, including Logstash parsing and Kibana visualizations, can also be steep for teams without prior experience.
Business Value and ROI of ElasticSearch Log Analytics
The return on investment (ROI) from implementing ElasticSearch for ElasticSearch Log Analytics is substantial and multifaceted. Organizations leveraging ElasticSearch can expect:
- Faster Model Deployment and Troubleshooting: By providing real-time visibility into application and infrastructure performance, ElasticSearch significantly reduces the mean time to detect (MTTD) and mean time to resolve (MTTR) issues. This translates to less downtime, improved service availability, and higher customer satisfaction. Developers can quickly identify errors in new deployments, and operations teams can preemptively address bottlenecks.
- Enhanced Data Quality for AI/ML: High-quality, readily available log data is a critical input for training and validating AI and Machine Learning models, especially in areas like anomaly detection, predictive maintenance, and security threat intelligence. ElasticSearch’s ability to process and structure this data makes it a valuable foundation for data-driven AI initiatives.
- Proactive Monitoring and Operational Excellence: Teams can move from reactive firefighting to proactive monitoring. Automated alerts based on thresholds or ML-driven anomaly detection can notify engineers of potential issues before they escalate, ensuring smoother operations and preventing costly outages.
- Improved Security Posture and Compliance: Security analysts can swiftly search through massive volumes of security logs (firewall logs, authentication logs, endpoint activity) to detect suspicious patterns, investigate incidents, and respond to potential threats with unprecedented speed and precision. Its capabilities support compliance requirements by providing auditable trails of system activity.
- Cost Savings through Efficiency: While infrastructure costs exist, the efficiency gained from automated log analysis, reduced manual effort, and faster problem resolution often outweighs these expenses, leading to overall operational cost savings.
Organizations increasingly rely on ElasticSearch to transform their overwhelming log data into actionable intelligence, empowering them to make faster, more informed decisions about their infrastructure and security posture, ultimately driving competitive advantage.

Comparative Insight: ElasticSearch vs. Traditional Data Lakes/Warehouses
When considering solutions for large-scale data analytics, it’s essential to understand how ElasticSearch differentiates itself from traditional data paradigms like data warehouses and data lakes. While all aim to store and analyze data, their architectural philosophies, primary use cases, and performance characteristics are vastly different, especially concerning ElasticSearch Log Analytics.
Traditional Data Warehouses (DW) are optimized for structured, historical data, primarily for business intelligence and reporting. They enforce a schema-on-write approach, meaning data must conform to a predefined structure before ingestion. While excellent for aggregate queries over well-defined datasets, DWs struggle with the unstructured, high-velocity nature of log data. Ingesting and querying raw log entries in a DW would be slow, resource-intensive, and require significant data transformation upfront, making real-time analysis impractical.
Data Lakes, on the other hand, are designed to store vast amounts of raw, multi-structured data at a low cost, often utilizing technologies like HDFS or cloud object storage (e.g., S3). They employ a schema-on-read approach, allowing flexibility in data ingestion. Data lakes are excellent for long-term storage, large-scale batch processing, and machine learning workloads where data scientists need access to raw, untransformed data. However, their strength lies in batch processing, not real-time interactive querying of text-heavy data. Performing ad-hoc, full-text searches across petabytes of log data in a data lake typically requires complex, time-consuming queries using tools like Spark or Presto, which are not optimized for the inverted index searches that ElasticSearch excels at.
ElasticSearch fills a critical gap by providing a highly specialized solution for real-time, full-text search and analytical aggregation on semi-structured and unstructured data, particularly logs. Its inverted index is purpose-built for rapid text search, a capability that neither traditional DWs nor data lakes natively offer at scale with the same performance. ElasticSearch prioritizes speed of ingestion and querying for transient, evolving data like logs, making it ideal for operational intelligence, security monitoring, and application performance management where immediate insights are paramount. While a data lake might store the raw logs for archival or deep historical analysis, ElasticSearch provides the front-end, interactive analytics layer that operational teams depend on daily.
In essence, ElasticSearch is not a replacement for a data warehouse or a data lake but rather a complementary technology. It serves as the high-performance operational analytics engine, providing immediate access to granular log data, while data lakes might act as the long-term, cost-effective repository for all data, including logs, for broader analytical purposes.

World2Data Verdict: The Future of Log Intelligence
The relentless growth of data volume and the increasing complexity of IT environments solidify ElasticSearch’s position as a cornerstone technology for modern observability and operational intelligence. World2Data.com recognizes that while the initial setup and management of large ElasticSearch clusters can present challenges, the strategic advantages far outweigh the complexities. Its unparalleled speed in searching and aggregating vast log datasets, coupled with its robust scalability and powerful visualization tools like Kibana, make it an indispensable asset for any organization striving for peak operational efficiency and advanced security.
Our recommendation for enterprises is to invest not just in the technology, but in developing the internal expertise required to fully leverage ElasticSearch’s capabilities. Proactive management, careful cluster design, and continuous optimization are key to maximizing ROI. Looking forward, the integration of advanced machine learning features directly within ElasticSearch for anomaly detection, forecasting, and root cause analysis will continue to mature, transforming reactive monitoring into predictive intelligence. Organizations that effectively harness ElasticSearch Log Analytics will gain a significant competitive edge, turning what was once overwhelming noise into a clear, actionable signal for innovation and resilience.


